

Question
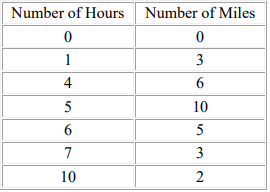
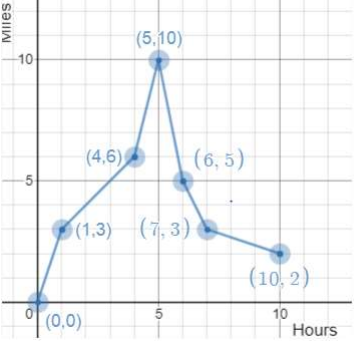
The data listed below represents the distance from a city taxi depot (to the nearest
mile) by the number of hours since a taxi left the depot to pick up passengers.
Provide your answer below:
According to the information above, which of the following is an appropriate analysis
of the taxi’s distance?
Select the correct answer below:
From the data, the taxi was closest, in miles, from the depot after 10 hours.
From the data, the taxi was farthest, in miles, from the depot after 4 hours.
From the data, the taxi was closest, in miles, from the depot after 5 hours.
From the data, the taxi was farthest, in miles, from the depot after 5 hours.…Kindly click the purchase icon to access the full solution at $5