
Question
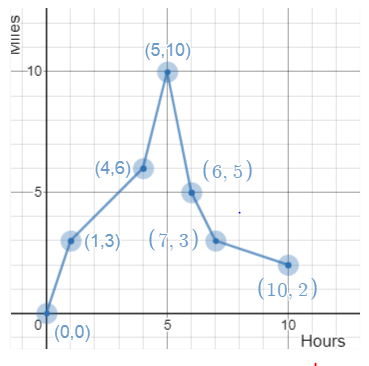
The data listed below represents the distance from a city taxi depot (to the nearest mile) by the number of hours since a taxi left the depot to pick up passengers.
| Number of Hours | Number of Miles |
| 0 | 0 |
| 1 | 3 |
| 4 | 6 |
| 5 | 10 |
| 6 | 5 |
| 7 | 3 |
| 10 | 2 |
Create the corresponding line graph to represent this data below.
Provide your answer below:
You can also look at (Solution) MATH225 Week 2 Quiz
Question
According to the information above, which of the following is an appropriate analysis of the taxi’s distance?
Select the correct answer below:
From the data, the taxi was closest, in miles, from the depot after 10 hours.
From the data, the taxi was farthest, in miles, from the depot after 4 hours
From the data, the taxi was closest, in miles, from the depot after 5 hours.
Solution
….Kindly click the purchase icon to purchase the full quiz solution at $10
Total Views: 28