

Question
Randomly selected adults at a coffee shop were asked how many hours they work in a typical workday. The results are tabulated in the following frequency table.
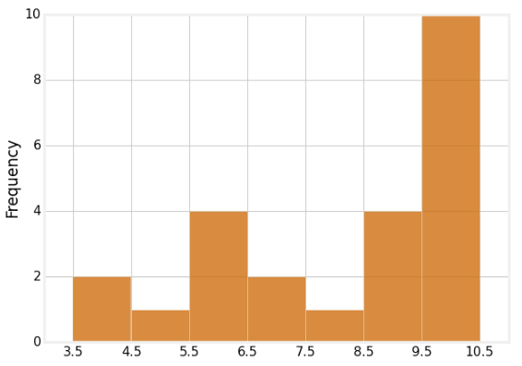
Which histogram accurately summarizes the data?
| Value | Frequency |
| 4 | 2 |
| 5 | 1 |
| 6 | 4 |
| 7 | 2 |
| 8 | 1 |
| 9 | 4 |
| 10 | 10 |
Ans:
You can as well check out (Solution) MATH225 Week 2 Assignment Stem and Leaf plots
Question
A student surveys his class and creates a histogram showing the number of pets in each student’s house. What is the shape of the distribution?
….Kindly click the purchase icon to purchase the full quiz solution at $5