(Solution) MATH225 Week 2 Assignment Line and Bar Graphs
Question
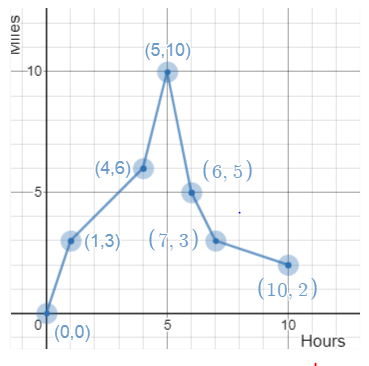
The data listed below represents the distance from a city taxi depot (to the nearest mile) by the number of hours since a taxi left the depot to pick up passengers.
Number of Hours
Number of Miles
0
0
1
3
4
6
5
10
6
5
7
3
10
2
Create the corresponding line graph to represent this data below.
Question According to the information above, which of the following is an appropriate analysis of the taxi’s distance?
Select the correct answer below:
From the data, the taxi was closest, in miles, from the depot after 10 hours. From the data, the taxi was farthest, in miles, from the depot after 4 hours From the data, the taxi was closest, in miles, from the depot after 5 hours.
Solution ….Kindly click the purchase icon to purchase the full quiz solution at $10