

Question
The five number summary for a set of data is given below.
| Min | Q1 | Median | Q3 | Max |
| 54 | 56 | 80 | 86 | 87 |
Using the interquartile range, which of the following are outliers? Select all correct answers.
Ans:
1
You can as well check out (Solution) MATH225 Week 3 Assignment Standard Deviation.
Question
The following frequency table summarizes a set of data. What is the five-number summary?
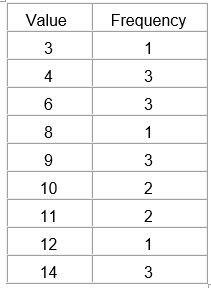 Ans:….Kindly click the purchase icon to purchase the full quiz solution at $10